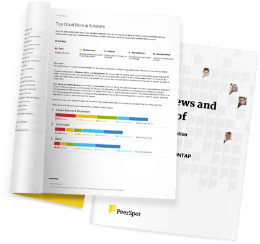
Teams that switch to VictoriaMetrics report 70% less RAM and 75% less disk (verified PeerSpot user reviews), and cloud bills up to 10x lower (Grammarly case study) — while keeping their existing dashboards and alerting rules working. It is an open source observability solution for metrics, logs, and traces: a drop-in replacement for Prometheus and other backends that keeps scaling when data volume, query speed, or cost no longer does. It runs anywhere — from a Raspberry Pi to thousand-core clusters, on-premises or in the cloud — and is Kubernetes- and OpenTelemetry-compatible. Built by engineers, for engineers: Over 1B Docker pulls, 19M GitHub downloads, and 27K+ GitHub stars. Simple, reliable, and efficient observability for everyone.
VictoriaMetrics delivers observability in two complementary forms. The open source products are complete, production-grade, and free to run at any scale. Enterprise builds on that same code with capabilities and support for the most demanding environments — it extends open source rather than gating it.
Open source. VictoriaMetrics is a high-performance time series database and monitoring solution, compatible with PromQL via MetricsQL, so existing Prometheus dashboards, recording rules, and alerting rules keep working. VictoriaLogs is a logs database for mission-critical logging, and VictoriaTraces stores and queries distributed tracing data. All three are engineered for minimal RAM, disk, and compute at high ingestion rates.
Enterprise. VictoriaMetrics Enterprise adds features for large, multi-team deployments — plus direct support from the engineers who build the product, with architectural and security guidance. VictoriaMetrics Cloud is the same solution fully managed, and VictoriaMetrics Anomaly Detection applies machine learning to cut alert noise, so the alerts that do reach your team in Slack or on their phones are the ones that matter.
Measured results from users. PeerSpot reviewers report roughly 70% lower RAM use, 75% lower disk use, 3x faster writes, and 7x faster p95 query latency after replacing Prometheus. Grammarly cut its monitoring-related AWS bill about 10x; Granulate reduced metrics storage costs about 5x after moving from Grafana Cloud (Mimir).
Why teams choose VictoriaMetric
-
The economics are structural, not promotional. The core solution is open source — no per-host, per-agent, or per-GB pricing. Efficiency gains come from the storage engine itself, so costs stay flat as telemetry grows.
-
Operational simplicity. A single binary to start, one operator for Kubernetes — teams have gone from download to a running test system in about 20 minutes, not a quarter-long migration project.
-
You own your observability. Run it on any cloud or on-premises. Enterprise support comes directly from the engineers who write the code — an extension of open source, never a replacement for it.
What are the key features of VictoriaMetrics?
-
High performance: Ingests and queries millions of data points per second with a fraction of the RAM, disk, and compute of comparable stacks.
-
Full observability coverage: Metrics, logs (VictoriaLogs), and traces (VictoriaTraces) in one consistent, open source solution.
-
Drop-in Prometheus compatibility: MetricsQL supports PromQL, so existing dashboards, recording rules, and alerting rules keep working — alerts still reach your team in Slack or on their phones, just from a faster backend.
-
Scalability in both directions: Single-node for a homelab, cluster mode for thousands of cores; on-premises or cloud, Kubernetes- and OpenTelemetry-native.
-
Multi-tenancy: Isolates data streams per team, client, or environment on shared infrastructure.
-
Efficient compression: Purpose-built time series compression — users report disk usage cut by 75% after migrating from Prometheus.
What benefits and ROI should users expect?
-
Lower infrastructure spend: Verified PeerSpot reviewers report roughly 70% less RAM and 75% less disk; published case studies show up to 10x lower cloud bills (Grammarly) and about 5x lower metrics storage costs (Granulate).
-
Fast time to value: A drop-in replacement — teams have stood up first test systems in about 20 minutes (Max Planck Institute).
-
Performance at scale: 3x faster writes and 7x faster p95 query latency versus prior Prometheus setups, per PeerSpot reviewers.
-
Longer retention: Keep months or years of data affordably instead of discarding it after weeks.
-
A clear growth path: Start with open source; add Enterprise features, managed Cloud, or AI-powered Anomaly Detection when scale demands it — Enterprise extends open source, it never gates it.
Top use cases
-
Drop-in Prometheus replacement at scale — CERN's CMS collaboration and the Max Planck Institute for Gravitational Physics both migrated for compatibility and scale.
-
Observability cost reduction — Grammarly (about 10x lower AWS bill) and Granulate (about 5x lower metrics storage cost).
-
Kubernetes and cloud-native monitoring — official operator with LTS releases, OpenTelemetry ingestion.
-
LLM and AI workload observability — OpenLIT SDK integration for monitoring LLM apps and agents.
VictoriaMetrics runs in production across finance, telecommunications, energy, scientific research, and IoT — from CERN's particle physics experiments to IHI Terrasun's utility-scale battery storage to Grammarly's product infrastructure. Wherever real-time telemetry at scale is critical, it delivers simple, reliable, and efficient observability for everyone. By engineers, for engineers.